
© 2026. All rights reserved.
© 2026. All rights reserved.
Bayesian network (BN) is a probabilistic graphical model (PGM). It can visualise complex dependence between many random variables, which makes it much easier to formulate a high-dimensional probabilistic model.
In a BN graph, random variables are represented by circular nodes, and their dependence is represented by directed arrows.
For more information about PGM, I strongly recommend Koller (2009).
For example, consider an example BN in Fig. 1, which represents a system event subjected to some hazard risk. In the graph, random variables $H$, $X_1, \cdots, X_N$, and $S$ respectively represent intensity of a hazard event, component events, and a system event.
In this problem, we can use BN to model causal relationship between the random variables. In Fig. 1, hazard $H$ affects performance of components $X_1,\cdots,X_N$, which then determine performance of system $S$.
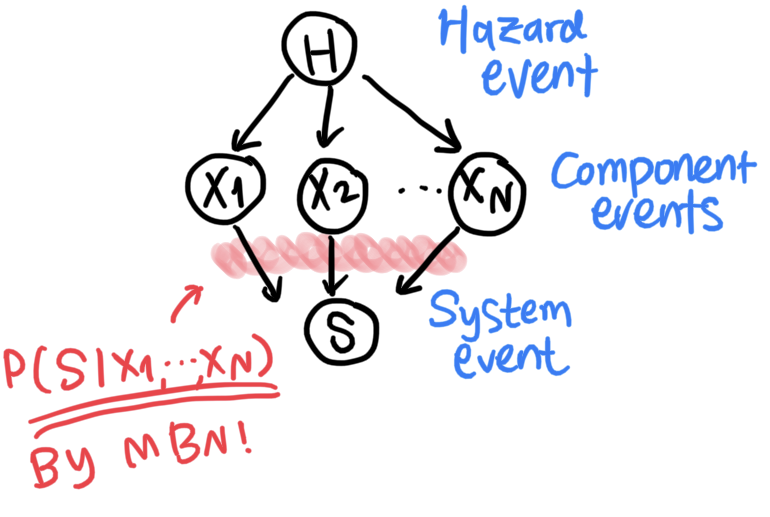
Once a BN graph is set up, each node is assigned a conditional probability on their parent nodes. For instance, the BN in Fig. 1 has $P(H)$, $P(X_1 \left. \right\vert H),\cdots,P(X_N \left. \right\vert H)$, and $P(S \left. \right\vert X_1, \cdots, X_N)$.
Then, the joint probability represented by the BN is simply the product of all these variables, i.e.
$$P(S,X_1, \cdots, X_N,H)=P(S \left. \right\vert X_1, \cdots, X_N)\cdot P(X_1 \left. \right\vert H)\cdot \cdots \cdot P(X_N \left. \right\vert H)\cdot P(H).$$